MRTG Patterns November 1, 2003 at 12:29 pm
I’ve been running mrtg on my host for awhile now to keep an eye on usage of the networks. I’ve got seperate data for my cable modem connection, my internal wired network, and my internal wireless network.
Sometimes it’s interesting to see the charts and relate the patterns to what I (or someone else) is doing. Here’s the last 24 hours of my internal net:
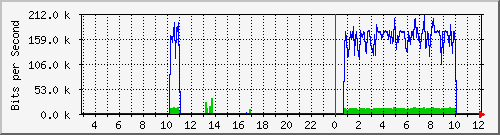
The plateaus (well, this detailed they’re spikey, but the fairly level outbound/blue bits) show when I’m streaming music to my audiotron. I had the one in my bedroom streaming all night while I was sleeping. The smaller one earlier in the day is when I had music playing while getting ready for work on Friday morning.
Here’s a weekly chart:
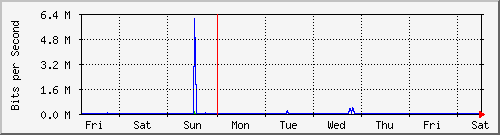
The spike you see on Sunday was during the fires. The data rate is so high because I was doing an emergency backup of my really important data (everyone’s email, my website stuff, databases) to my laptop just in case we had to evacuate this area and I didn’t have time to pull my server to take it with me.
If you look at the charts you’ll note that the cablemodem connection (top left, labeled www.miguelito.org) always has a constant input rate. That input rate is the massive amount of arp traffic that’s always visible on the cable modem connection. If you click on the chart and look at the yearly one, you’ll see that it really ramped up around Aug… I think the arp traffic has increased due to the newer windows worms out there that started this summer, and are causing hosts to scan for open relays, exploits, etc like crazy.
Leave a Reply